At the end of the 19th century, one nurse in particular, changed the future of medical care by analysing historical data from her patients. Her name, was Florence Nightingale and she was a pioneer in data management and a statistician. You might know her as . the “Lady with the Lamp” which makes reference to her practice of night-time rounds visiting patients.
As a British nurse, who lived from 1820 to 1910, she gathered and analyzed patient data to improve the quality of care. Serving in the military hospital in Scutari, now Üsküdar in Istanbul during the Crimean War (1853 to 1856). She led a team of 38 nurses to staff the British Army hospital. Nightingale and her team arrived in Turkey in November 1854 facing horrendous sanitary conditions and poorly kept medical records. Organising those records, collecting and analysing the data, she and her team painstakingly worked to reduce mortality rates and were successful in bringing them down from 32% to 2%.
When Nightingale returned to London 3 years later, she was a national hero. At the end of the War, under the patronage of Queen Victoria she continued to work on data analysis by leading the Royal Commission on the Health of the Army. In this role she arrived at important conclusions on the causes of death among soldiers.

She was a skilled mathematician and understood the importance of health data. She further argued (unsuccessfully) that Parliament should extend the 1860 census to collect data on sickness and disability, and she advocated for the creation of a Chair in Applied Statistics at Oxford University.
Nightingale was “in many ways the mother of statistical data designed to address health outcomes,” – Deva-Marie Beck, Nightingale Initiative for Global Health (NIGH)
The Royal Statistical Society acknowledged her contributions to health data by electing Florence Nightingale to membership of the Society . She was the first woman member of the society and the American Statistical Association also made her an Honorary Member.
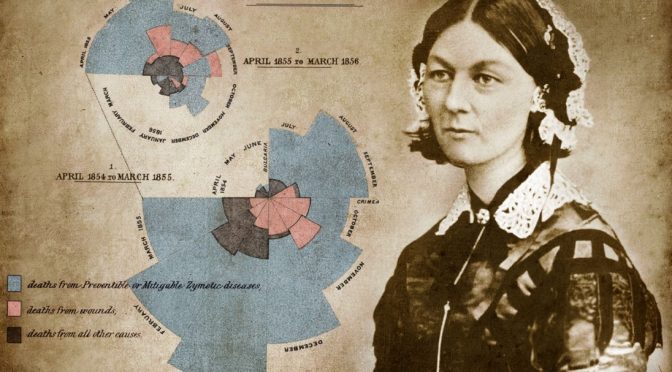
To make sure that the details of her statistical analysis could be understood by Parliamentarians and the proposed and executed measures, she used visualization and presented the data in easily understood charts.
Nightingale’s dedication and meticulous record keeping and analysis led to major reforms and she is now widely considered to be the founder of epidemiology (the study of health and disease in population groups) and of modern day nursing methods.
Her distinctive “coxcomb” graph was a precursor to the modern day pie chart. She used a “polar area diagram” to depict mortality data from the Crimean War including the number and causes of deaths. It is considered more accurately a wedge diagram and uses three different colors to show deaths from preventable diseases, war wounds or other causes according to Barbara Dossey, a nursing historian and scholar on the life and times of Nightingale.
If you ever visit London, England and have a few hours to spare, pay a visit to the Florence Nightingale Museum located at St Thomas’ Hospital, which faces the Palace of Westminster across the River Thames in South Bank, central London, England. It is open to the public seven days a week and well worth a visit.
Read More at :
- Florence Nightingale: Founder of Modern Nursing and Hospital Epidemiology
- Florence Nightingale’s Statistical Diagrams
- 105th Anniversary of Florence Nightingale’s Death
- Florence Nightingale, data journalist: information has always been beautiful
- Florence Nightingale, Data Visualization Pioneer
- Florence Nightingale and the early origins of evidence-based nursing
- Celebrating statisticians: Florence Nightingale
The original posting of this article was in 2017 under a different title on LinkedIn